All posts · Quant trading · Backtesting · Trend following
What Is Quant Trading? Explained Simply
Learn what quant trading is, how quantitative strategies work, common examples, and the risks beginners should understand before using them.
· 9 min read
Quant trading, short for quantitative trading, is an approach that uses mathematical models, statistical analysis, and historical or current market data to identify potential trading opportunities.
Instead of relying entirely on intuition or manually interpreting charts, a quant trader uses defined rules to analyse markets and decide when a trade might be worth taking. Some strategies run automatically through computer programs, while others use quantitative analysis to support decisions made by a human trader.
Quant trading is used across financial markets, including stocks, forex, futures, bonds, and other instruments. However, it isn't limited to large banks or sophisticated hedge funds. Retail traders can also explore quantitative methods using spreadsheets, trading platforms, coding tools, and historical market data.
The important distinction is that quant trading provides a structured way to make decisions. It does not eliminate uncertainty or guarantee profitable results.
How Does Quant Trading Work?
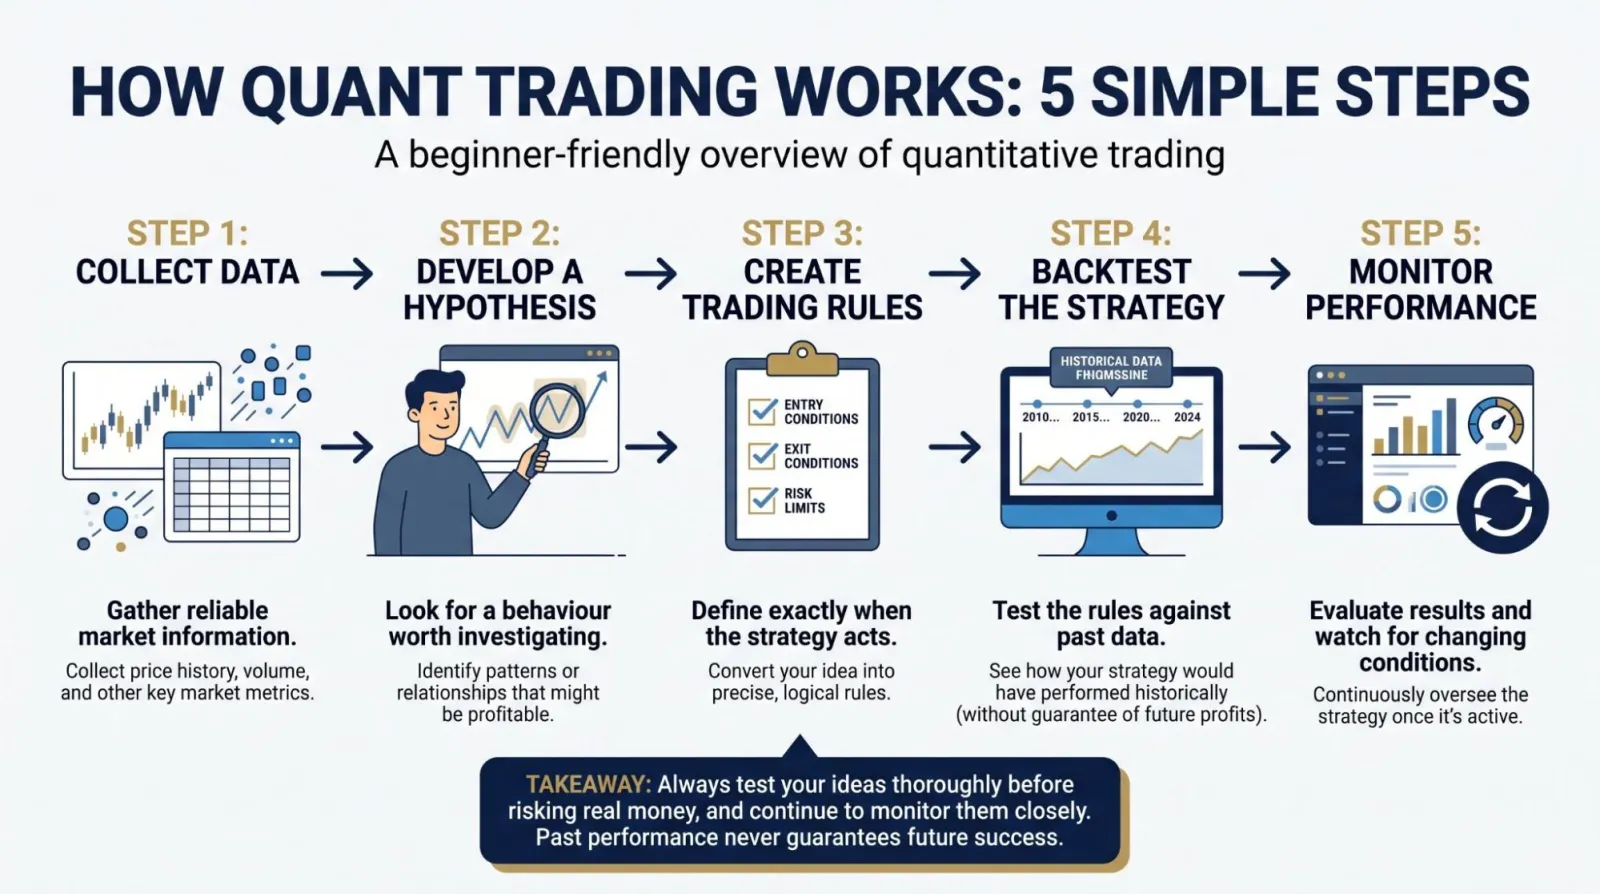
At its core, quantitative trading follows a process: collect data, identify a potential pattern, turn that pattern into rules, test the rules, and use the results to guide trading decisions.
1. Collect market data
A quantitative strategy needs information to analyse. Depending on the strategy, this might include historical prices, trading volume, interest rates, economic indicators, or relationships between different financial instruments.
For example, a forex trader might collect daily EUR/USD prices over several years to examine how the exchange rate behaves under particular market conditions.
The usefulness of the analysis depends partly on the quality of the data. Missing prices, incorrect timestamps, or unreliable information can distort the results.
2. Develop a trading hypothesis
Next, the trader looks for a relationship or behaviour that might help identify opportunities.
For example, a trader might hypothesise that a currency pair showing strong upward momentum over a certain period may continue rising under some conditions.
That idea is only a hypothesis at this stage. A pattern observed in a chart does not automatically represent a repeatable market advantage.
3. Turn the idea into measurable rules
The trader then defines exactly what the strategy should look for.
A simple momentum strategy might specify that a trade is considered when a short-term moving average rises above a longer-term moving average. It could also include conditions for exiting the trade and limiting risk.
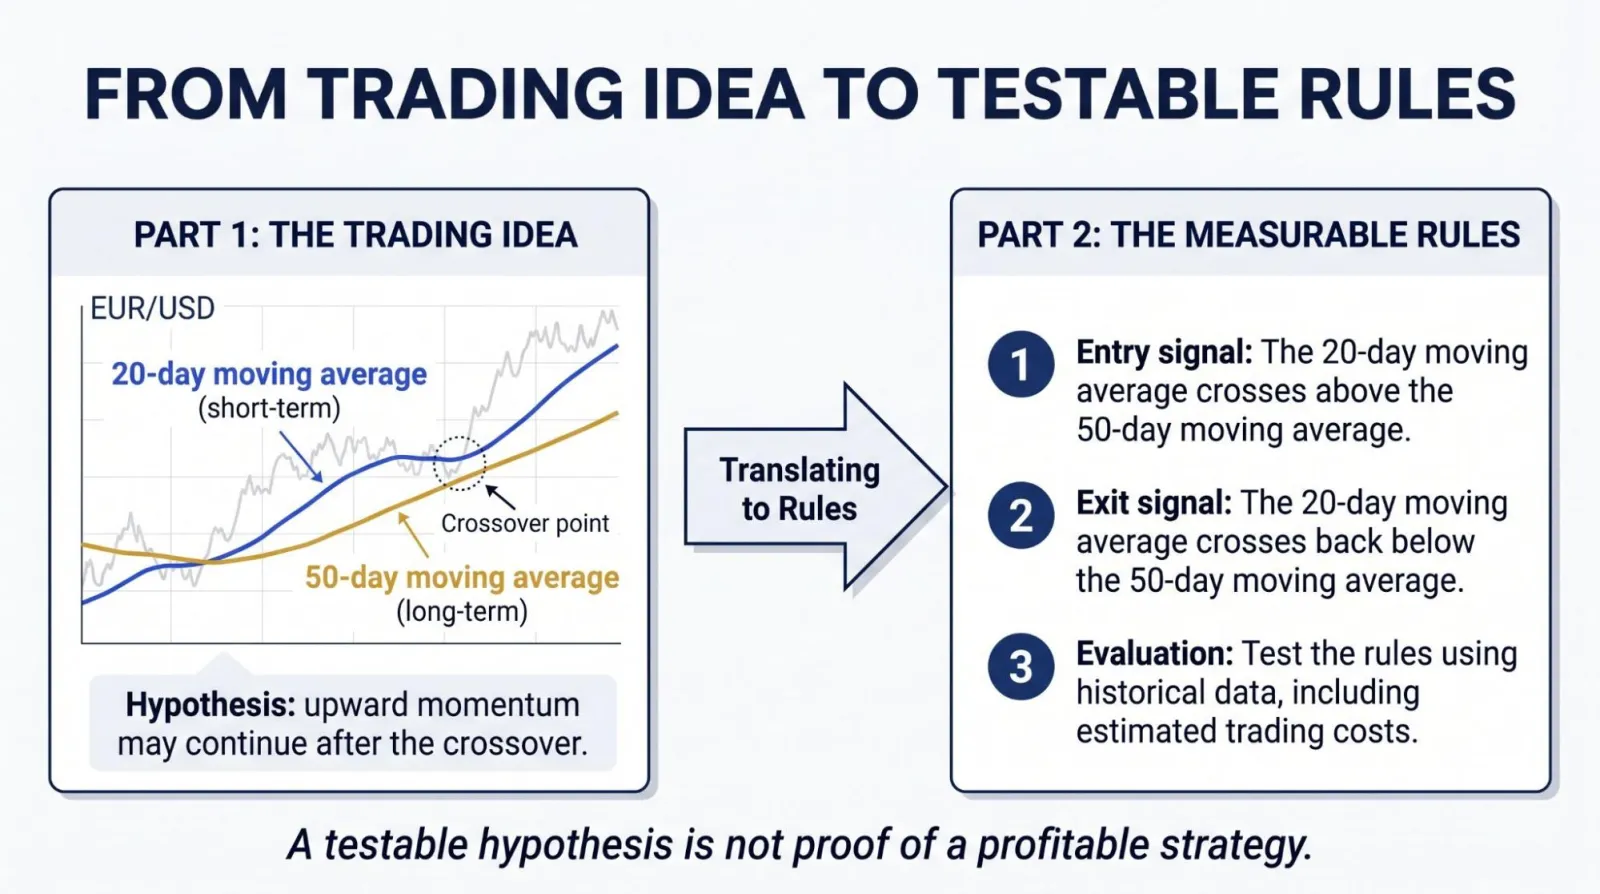
Clear rules matter because they make the strategy easier to test. If the entry and exit criteria change whenever the trader sees something new, it becomes difficult to determine whether the method works consistently.
4. Test the strategy
Before risking money, the trader can use historical data to simulate how the rules would have performed in the past. This process is called backtesting. In MetaTrader, that's the job of the Strategy Tester.
A useful backtest considers more than whether the strategy correctly anticipated price movements. It should also account for factors such as transaction costs, spreads, slippage, and the timing of trades.
A strategy that appears profitable before costs may perform very differently once realistic trading expenses are included.
5. Apply and monitor the strategy
If the results justify further investigation, the trader may test the strategy on data that was not used to develop it, run it in a demo environment, or begin with carefully controlled exposure.
The process doesn't end when a strategy goes live. Market conditions can change, data feeds can fail, and software can behave unexpectedly. Quant traders need to monitor performance and check whether the assumptions behind their strategies remain reasonable.
A Simple Example of Quant Trading
Imagine a trader wants to test whether a moving-average crossover can help identify trends in EUR/USD.
The trader creates a basic rule:
- Entry condition: Consider a buy signal when the 20-day moving average crosses above the 50-day moving average.
- Exit condition: Close the simulated position when the 20-day moving average crosses back below the 50-day moving average.
- Testing method: Apply these rules to historical EUR/USD data and measure the results after estimated trading costs.
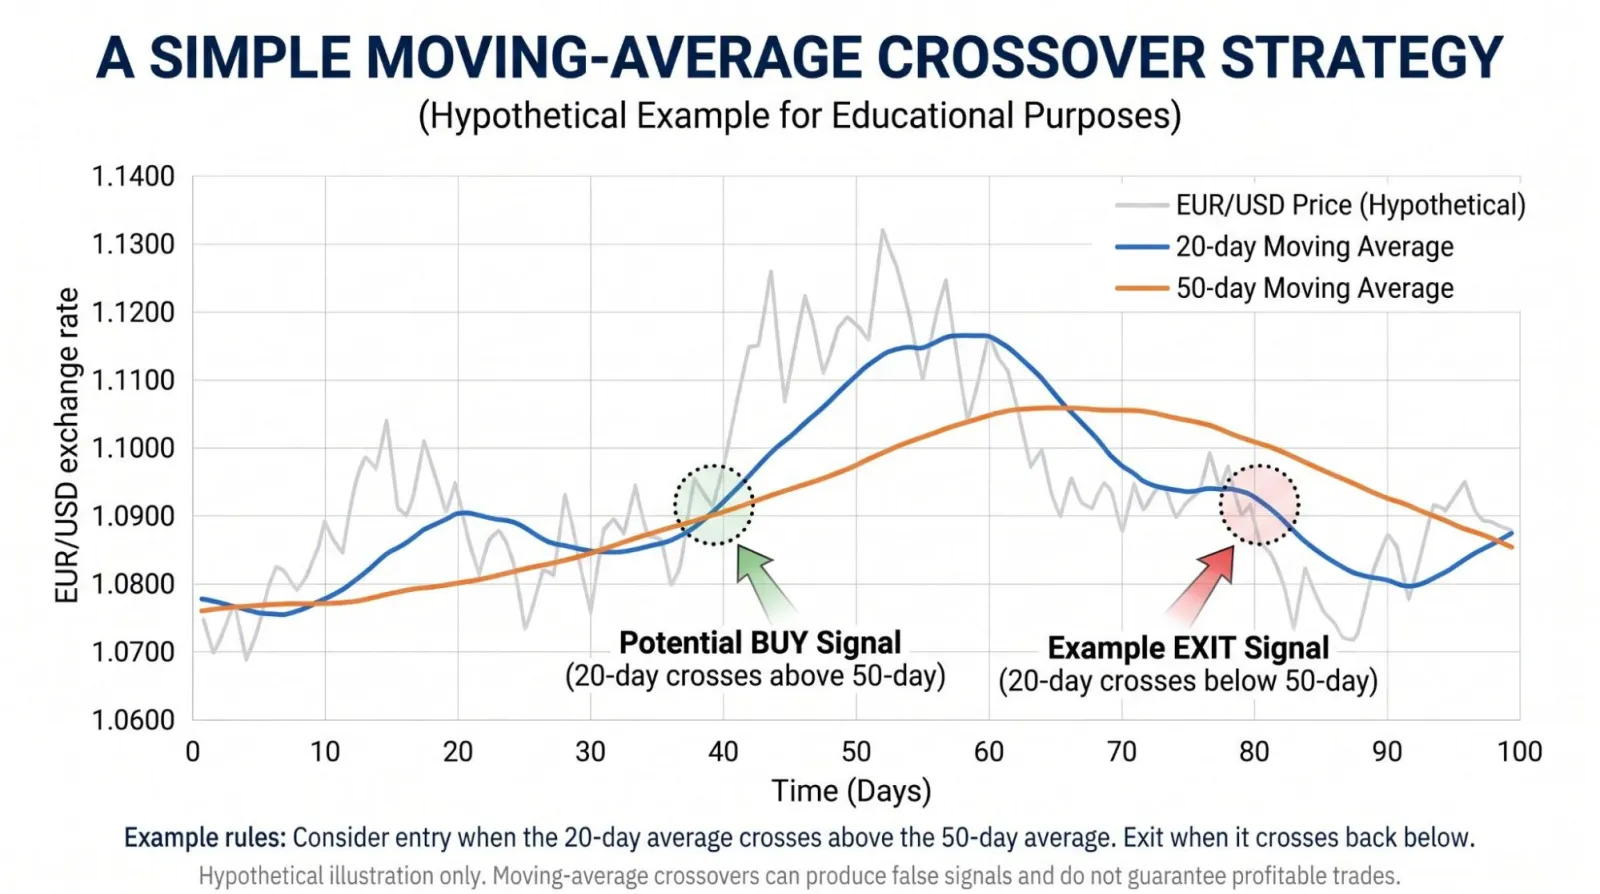
The computer can process the historical data and record every occasion when the conditions occur. The trader can then examine the strategy's returns, losing periods, drawdowns, and number of trades.
This is a simple example of quantitative analysis because the trading decisions follow measurable conditions rather than being made entirely through subjective judgment.
However, the example does not establish that the strategy is profitable. Moving-average crossovers can generate false signals, particularly when prices move sideways. The outcome also depends on the market, timeframe, costs, and precise rules used.
The purpose of testing is to evaluate the idea, not to prove in advance that it will work.
What Are the Main Types of Quant Trading Strategies?
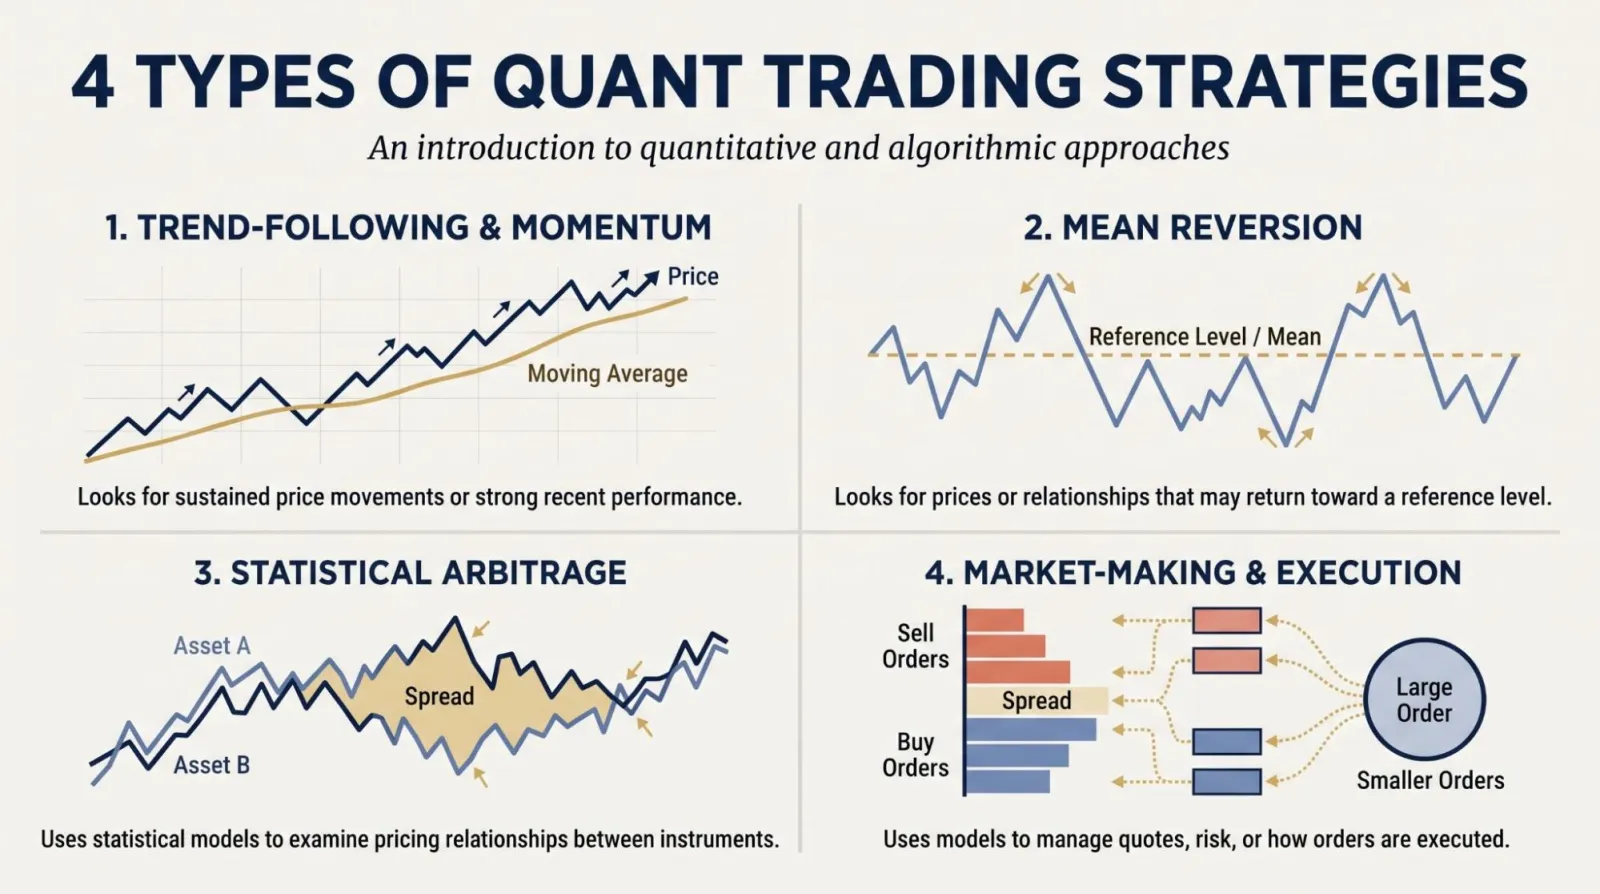
Quantitative strategies can take many forms. The approach depends on the behaviour the trader is trying to measure.
Trend-following and momentum
Trend-following strategies attempt to participate in sustained price movements. They may use moving averages, price breakouts, or other measurable indicators to identify trends.
Momentum strategies similarly look for assets that have been performing strongly or weakly over a defined period. The exact rules vary, and momentum can weaken or reverse unexpectedly. For how trend-following bots behave in different conditions, see trend following EAs: when they work and when they die.
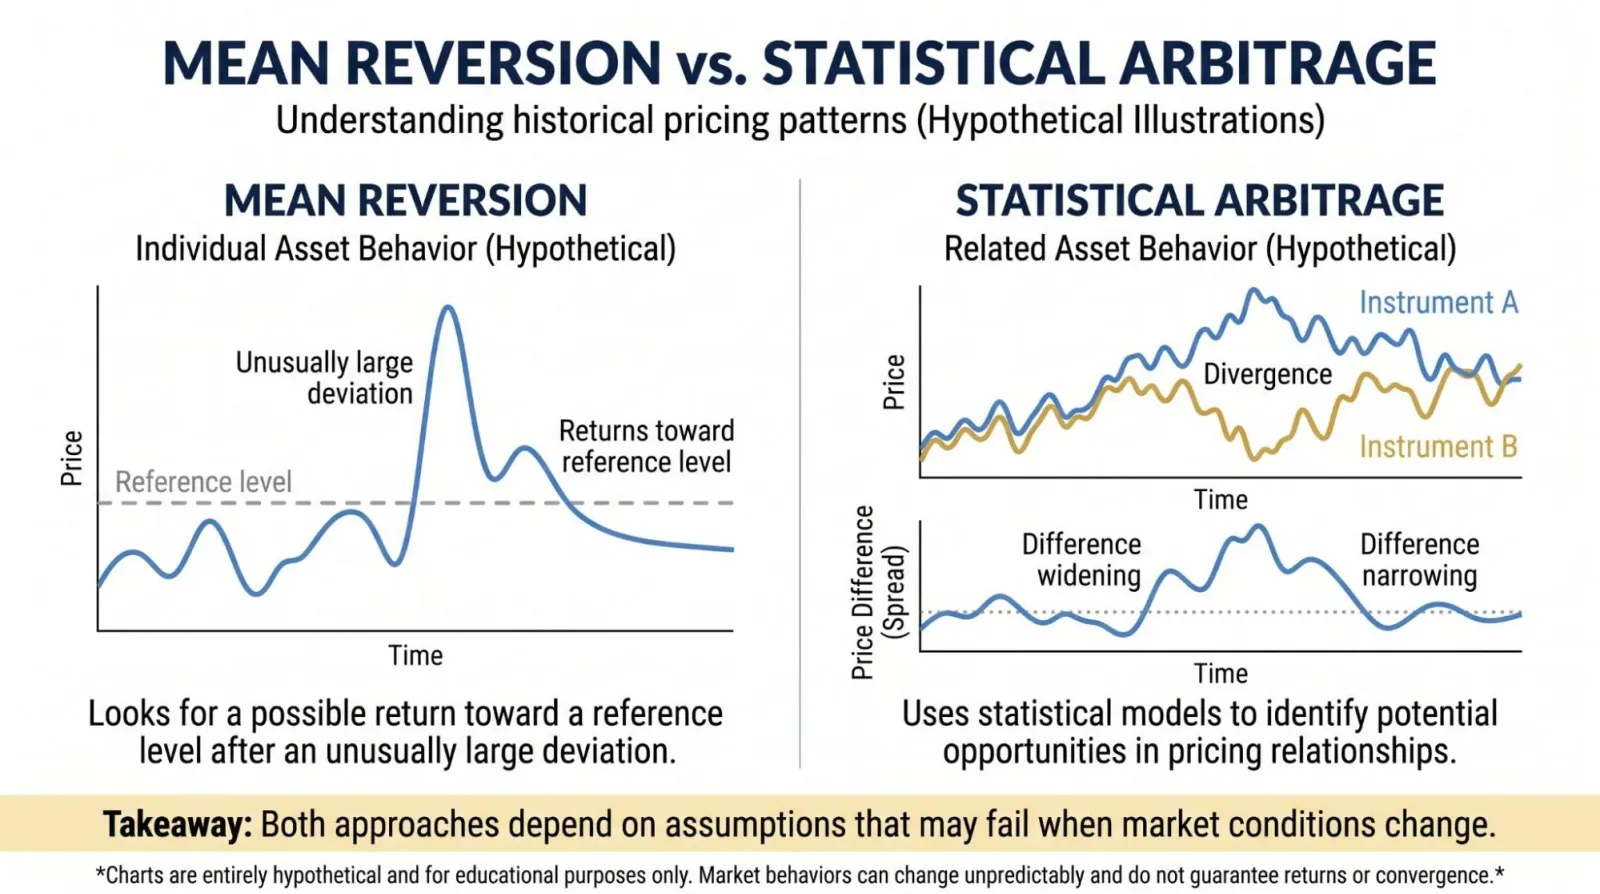
Mean reversion
Mean-reversion strategies look for situations where a price or relationship has moved unusually far from a reference level, with the hypothesis that it may move back toward that level.
For example, a strategy might monitor the spread between two historically related instruments. If the spread becomes unusually wide, the model may flag a potential opportunity.
The key assumption is that the relationship will revert. If the underlying relationship changes permanently, the strategy may perform poorly instead.
Statistical arbitrage
Statistical arbitrage uses statistical models to identify potential pricing relationships or short-term inefficiencies between instruments. Some approaches examine related securities, while others analyse more complex patterns across many assets.
These strategies can be technically demanding. Their results may also be sensitive to transaction costs, execution speed, and changes in market behaviour.
Market-making and execution strategies
Some quantitative systems focus less on predicting whether prices will rise or fall and more on managing how orders are placed and executed.
For example, an execution algorithm may divide a large order into smaller orders over time to manage its market impact. Market-making strategies may use models to help manage quotes, inventory, and risk.
These approaches illustrate that quantitative methods can support both trading decisions and the execution of trades.
Quant Trading vs. Algorithmic Trading: What's the Difference?
The terms are related, but they do not mean exactly the same thing.
Quant trading refers to using mathematical or statistical methods to develop or evaluate trading decisions. Algorithmic trading refers to using computer algorithms to determine or manage aspects of orders, such as their timing, price, size, or execution.
The two often overlap. A quantitative strategy may generate signals that an automated system executes. However, a trader can use quantitative analysis and still place trades manually. Conversely, an execution algorithm can follow instructions without independently deciding whether an asset is attractively priced.
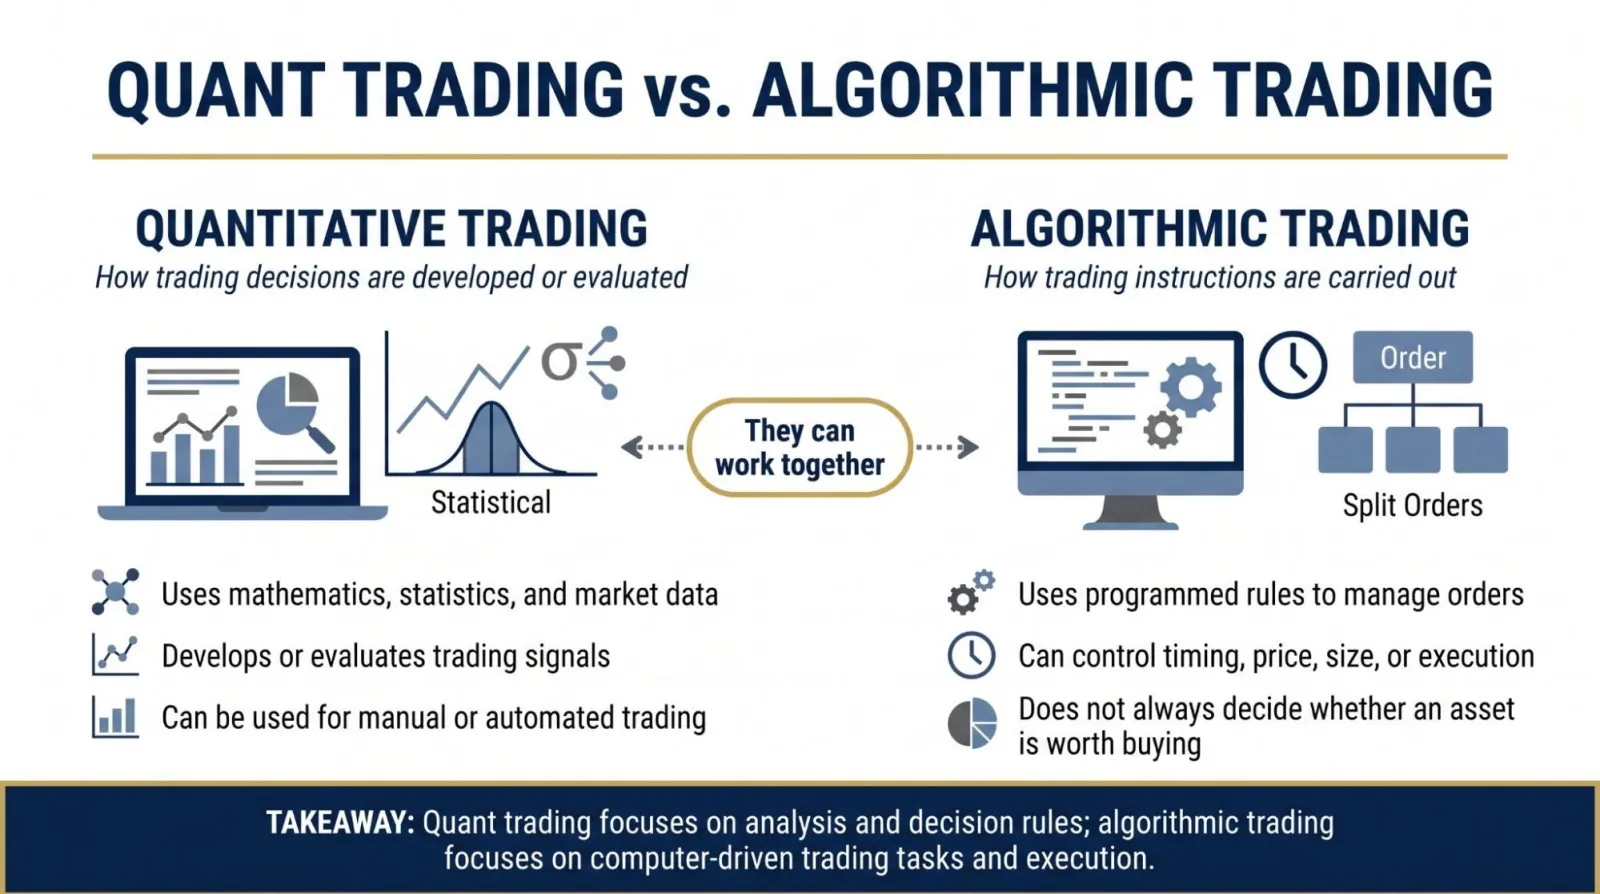
For example, a trader might use statistical analysis to decide that a particular stock is worth buying, then place the order manually. That uses quantitative analysis without necessarily automating execution.
Another trader might use software to split a large order into smaller orders according to a preset schedule. That is algorithmic execution, even if the software is not making the underlying investment decision.
Understanding this distinction helps beginners avoid assuming that all quant trading involves high-speed robots or that every automated trading system uses a sophisticated predictive model.
What Are the Advantages of Quant Trading?
Quant trading offers several practical benefits when the underlying method is sound.
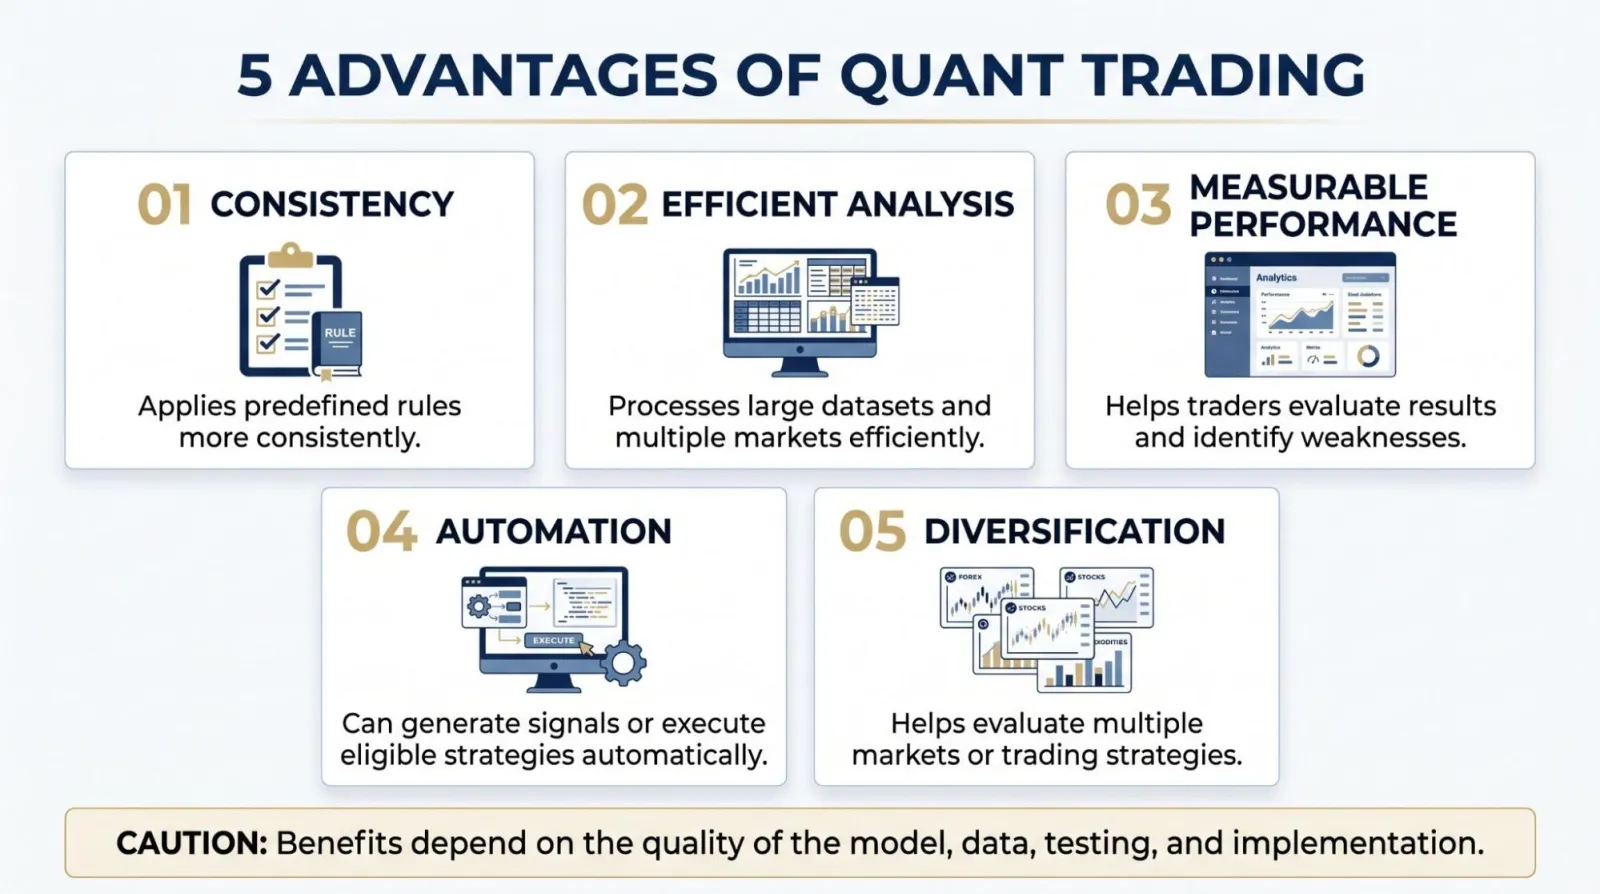
- Consistency: Defined rules can reduce the influence of momentary emotions and make decisions more repeatable.
- Efficient analysis: Software can examine large datasets and many instruments more quickly than a person working manually.
- Measurable performance: Traders can evaluate historical results, compare strategies, and examine weaknesses using consistent metrics.
- Automation: Suitable strategies can generate signals or execute orders automatically, reducing the need for constant manual intervention.
- Diversification: Quantitative methods can help traders evaluate multiple markets or strategies rather than relying on a single trading idea.
These advantages depend on implementation. A poorly designed model can apply bad rules consistently, process large amounts of misleading data, or automate losses just as efficiently as it automates valid decisions.
What Are the Risks of Quant Trading?
Quantitative methods do not remove the risks of financial markets. They introduce their own challenges, too.
Overfitting
Overfitting occurs when a strategy is adjusted so closely to historical data that it captures random patterns rather than a durable relationship.
A strategy may look impressive in a backtest but perform poorly on new data. Testing on separate data and keeping the model reasonably simple can help identify this problem, although neither approach guarantees future success.
Changing market conditions
A relationship that appeared useful in one environment may weaken or disappear in another. A trend-following strategy, for example, may struggle during choppy markets. That's why it helps to know which market regime a strategy was built for.
Traders need to consider how a strategy might behave under different conditions rather than assuming historical relationships will persist indefinitely.
Data and execution problems
Incorrect data, software bugs, internet interruptions, or failed orders can affect a live strategy. Actual trades may also differ from simulated results because of spreads, slippage, liquidity, and other execution costs.
Automated systems therefore require testing, monitoring, and appropriate safeguards. The U.S. Commodity Futures Trading Commission has discussed the importance of risk controls and system safeguards in automated trading environments.
False confidence in historical results
A strong backtest does not prove that a strategy will be profitable in the future. Historical data can help evaluate an idea, but it cannot account for every future market condition.
Traders should be cautious of claims that a quant strategy has a guaranteed win rate, cannot lose, or produces reliable profits in all markets.
Can Beginners Use Quant Trading?
Yes. Beginners can start learning quantitative trading without immediately building complex software or purchasing expensive tools.
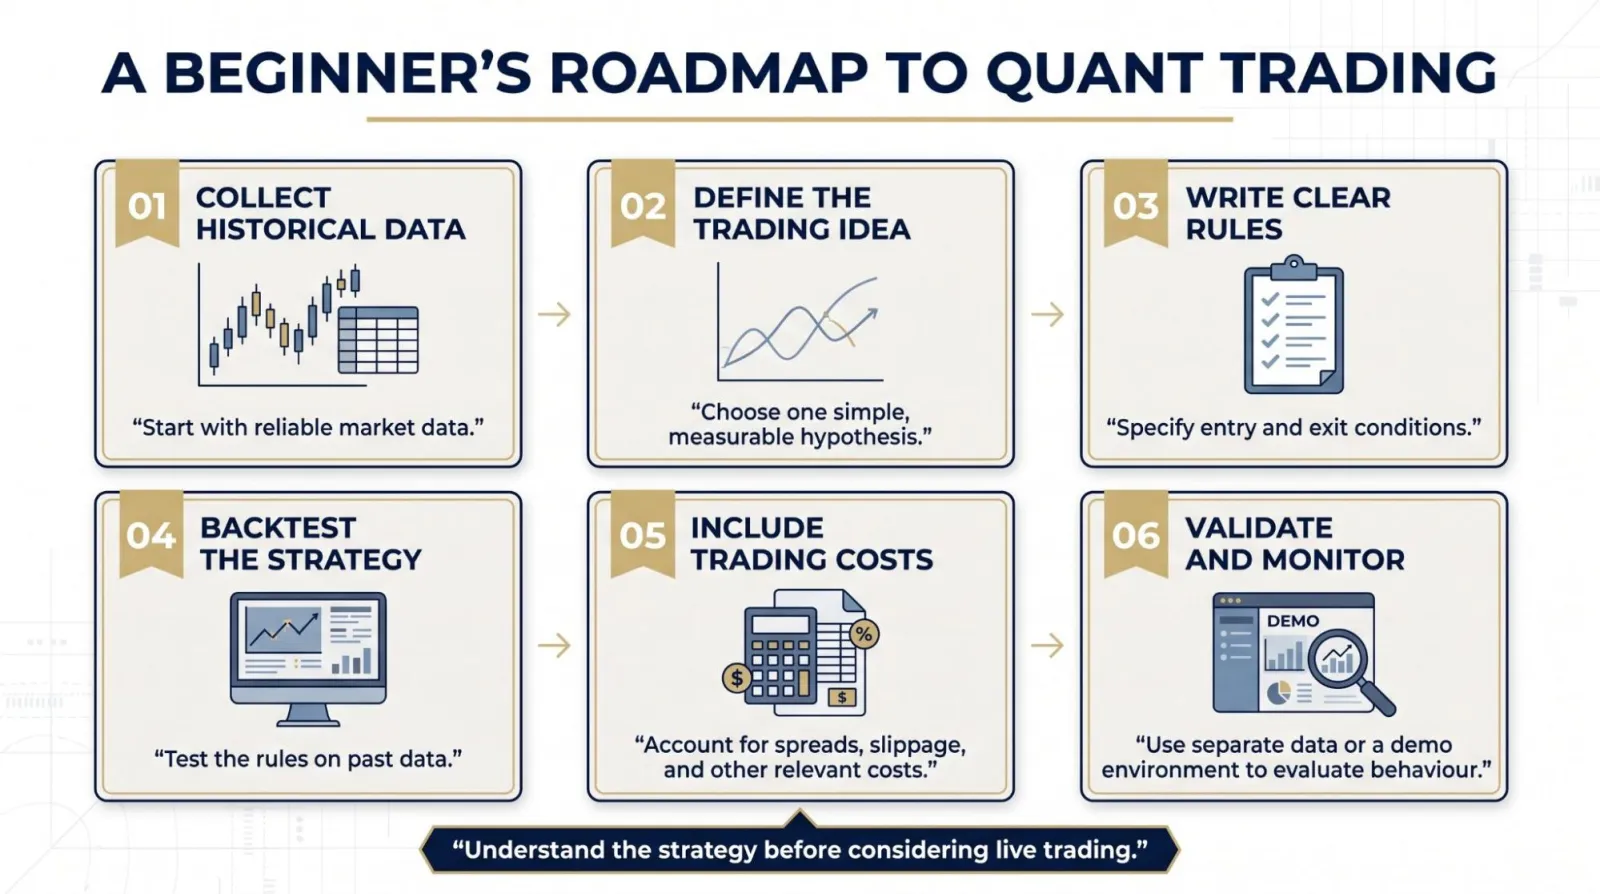
A practical starting point is to choose one market and investigate one simple, measurable idea. For example, a trader could study how EUR/USD behaved when its short-term moving average crossed above its long-term moving average.
A beginner can then:
- Obtain reliable historical price data.
- Write down clear entry and exit rules.
- Test those rules over a defined historical period.
- Include realistic transaction costs.
- Evaluate performance, drawdowns, and losing periods.
- Test the rules on separate data or in a demo environment before considering live use.
Spreadsheets can help with basic calculations, while platforms such as Python-based research environments or trading-platform strategy testers can support more advanced work. The right tool depends on the strategy and the user's technical experience.
It is usually more useful to understand one simple strategy's assumptions and weaknesses than to run a complicated model that the trader cannot explain.
Final Thoughts
Quant trading uses data, mathematics, and defined rules to analyse markets and guide trading decisions. It can help traders evaluate ideas more systematically, test strategies against historical information, and reduce reliance on intuition alone.
But the quality of a quantitative strategy depends on the quality of its data, the validity of its assumptions, the realism of its testing, and its ability to cope with changing market conditions. Automation does not make a weak strategy reliable, and historical performance does not guarantee future results.
For beginners, the best starting point is simple: learn how a strategy works, test its rules carefully, account for costs and risk, and remain sceptical of claims that any model can predict markets with certainty.
Build a bot from your idea
Describe your trading idea and the AI writes MT4 or MT5 code for you to review and test, with a plain-English explanation and setup steps. Your first bot is free.