All posts · Seasonality · Market analysis · Backtesting
What Is Seasonality in Trading? Larry Williams' Approach Explained
Learn how market seasonality works, what Larry Williams is known for, and how to test seasonal patterns before relying on them.
· 11 min read
Financial markets are influenced by economic data, interest rates, investor sentiment, and unexpected events. Yet traders sometimes notice that certain markets have shown recurring tendencies during particular months, seasons, or times of the year.
These recurring tendencies are known as market seasonality. Traders study seasonal patterns to understand whether historical price behaviour has tended to favour certain periods over others.
One trader closely associated with seasonal market research is Larry Williams, a well-known futures trader and technical analyst who has developed and discussed several trading methods throughout his career.
Seasonality can provide an additional perspective when analysing stocks, currencies, commodities, and other markets. However, a historical pattern is not a guarantee. A tendency that appeared frequently in the past may weaken, disappear, or reverse as economic conditions and market participants change.
This article explains what seasonality means, how traders evaluate seasonal patterns, what Larry Williams is known for, and how to incorporate seasonal research into a disciplined trading process.
What Is Market Seasonality?
Market seasonality refers to recurring tendencies in price behaviour or market activity during particular periods of the calendar year.
These patterns may occur because of repeated economic, commercial, or institutional activity. For example, agricultural commodities can be affected by planting and harvest cycles, while energy markets may respond to seasonal changes in heating and cooling demand.
Financial markets can also experience recurring calendar-related influences. Businesses may report earnings on quarterly schedules, investors may rebalance portfolios at particular times, and some economic activities tend to follow annual cycles.
Seasonality research examines whether these recurring influences appear to coincide with historical price patterns.
A seasonal tendency might suggest that a market has historically performed better during a certain month or that volatility has often increased around a particular period. Researchers can then test whether the pattern is sufficiently consistent to merit further investigation.
However, it is important to distinguish between a recurring pattern and a proven cause. A market may repeatedly rise during a particular month without the calendar itself being responsible. Other economic conditions or coincidental historical events may explain some or all of the observed behaviour.
Seasonality is therefore best treated as a hypothesis to test rather than a rule to follow automatically.
How Does Seasonal Trading Work?
Seasonal trading involves analysing historical market data to identify recurring price tendencies and assessing whether those tendencies may be useful under current conditions.
The process generally involves four stages.
1. Collect Historical Price Data
A trader begins by gathering historical prices for the market being studied. The data may cover several years or decades, depending on the market, the availability of reliable records, and the pattern being investigated.
For example, a trader studying gold seasonality might compare its historical monthly returns to see whether particular months have tended to produce stronger or weaker performance.
The data should be consistent and appropriate for the question being asked. Adjustments may be needed for stock splits, dividends, futures contract rollovers, or other market-specific characteristics.
2. Look for Recurring Patterns
Next, the trader examines whether similar behaviour has occurred across multiple years.
Useful measurements can include:
- Average return: The mean return during a particular month or seasonal window.
- Median return: The middle observed return, which can be less sensitive to unusually large gains or losses.
- Win rate: The percentage of historical periods that finished with a positive return.
- Volatility: How widely returns varied during the period.
- Maximum drawdown: The largest peak-to-trough decline experienced by the tested strategy or investment over the relevant period.
These measures answer different questions. A seasonal window with a high percentage of positive returns may still produce large losses in unfavourable years. Similarly, an attractive average return may be driven by only a small number of unusually strong observations.
A pattern should not be judged by one statistic alone.
3. Test Whether the Pattern Is Tradable
An apparent seasonal tendency is not necessarily a viable trading strategy.
A trader must consider when the position would be opened, when it would be closed, what would invalidate the trade, and how much capital would be at risk.
Trading costs also matter. Spreads, commissions, slippage, financing charges, and futures rollover costs can reduce or eliminate an apparent historical advantage.
The trader should test the strategy using realistic assumptions rather than assuming every historical entry and exit could have been executed at the displayed price.
4. Check Whether the Pattern Holds Up
A pattern that looks convincing in historical data may be the result of chance or excessive testing.
If a trader examines enough markets, months, entry dates, and exit dates, some combinations will appear unusually profitable simply by coincidence. This is one reason researchers use out-of-sample testing and other methods to assess whether a result is likely to persist.
A robust seasonal strategy should be examined across different market conditions and should not depend entirely on one exceptional year.
Who Is Larry Williams?
Larry Williams is an American trader, author, and technical analyst known for his work on futures markets, trading indicators, and systematic trading methods.
He has written about trading techniques and market behaviour, including approaches that use historical price patterns, market timing, and seasonal tendencies. His work has influenced traders interested in combining historical research with practical trading rules.
Williams is also associated with the Williams %R momentum indicator, which measures the relationship between a market's closing price and its recent high-low range. Although this indicator is widely used in technical analysis, it is distinct from seasonal analysis. Several short-term price patterns he popularized, such as the Oops pattern and the smash day, are covered in our pattern guides.
His broader work illustrates an important principle: trading methods should be defined by specific rules that can be examined and tested, rather than by vague observations about how a market usually behaves.
When researching a method attributed to Williams, traders should distinguish between his published work, later interpretations by other traders, and claims made by sellers of commercial indicators or trading systems. A product using his name does not automatically reproduce his original methodology or carry his endorsement.
How Larry Williams' Approach Relates to Seasonality
Larry Williams is particularly associated with studying recurring market tendencies and using historical data to investigate trading opportunities. Seasonal research asks whether certain calendar periods have displayed repeatable behaviour and whether that behaviour can be translated into explicit rules.
The central idea is straightforward: rather than assuming a market behaves randomly in every respect, a trader investigates whether recurring economic or market structures have produced observable tendencies.
For example, a trader might examine a commodity's historical performance during a particular seasonal window. If the market has shown a positive tendency over many years, the trader could investigate the possible reasons, determine how consistent the result is, and test a defined entry and exit method.
But it would be misleading to conclude that Larry Williams' work means traders should simply buy a market at a particular time every year. A seasonal strategy requires more than a calendar date. Its results depend on the market studied, the rules used, the sample period, and the costs and risks involved.
Before relying on a strategy attributed to Williams, traders should seek the original explanation or documented rules and test the method independently. Historical performance claims made in promotional material should not be treated as verified evidence without supporting data.
Examples of Seasonality Across Different Markets
Seasonal patterns vary by market because the underlying economic and commercial influences differ.
Agricultural Commodities
Agricultural markets provide some of the clearest examples of seasonal influences.
Planting schedules, growing conditions, harvests, weather patterns, storage levels, and crop reports can affect the supply of commodities such as corn, wheat, and soybeans.
For instance, uncertainty about crop yields during a growing season can affect prices before the harvest is complete. Once more information about supply becomes available, prices may respond differently.
However, weather events, global demand, government policies, and changes in inventories can override typical seasonal behaviour. Historical patterns should therefore be interpreted alongside current supply-and-demand information.
Energy Markets
Energy demand can change with the seasons. Colder weather may increase heating demand in some regions, while hotter weather can increase electricity consumption for cooling.
These patterns can affect natural gas, heating fuels, electricity markets, and related products.
But seasonal demand is only one side of the equation. Production levels, inventories, transportation constraints, geopolitical events, and changes in energy infrastructure can have a substantial impact on prices.
Stocks and Equity Indices
Stock markets are sometimes analysed for calendar-related tendencies, including month-of-the-year patterns and historical performance during certain parts of the year.
Traders may investigate whether an equity index has historically produced different average returns in different months. They should also consider dividends, market composition, transaction costs, and the effect of major outlier years.
A seasonal pattern in an index does not imply that every constituent stock will follow the same behaviour. Nor does it establish a dependable forecast for the next calendar period.
Gold and Other Metals
Gold traders may investigate historical monthly returns, jewellery demand, central-bank activity, and broader patterns in investment demand.
Some seasonal analyses associate particular periods with changes in physical gold demand, but the effects can vary across countries and years. Interest rates, real yields, dollar movements, geopolitical uncertainty, and investor flows can be more influential than a typical calendar tendency.
A seasonal pattern in gold should therefore be evaluated alongside the economic and financial conditions affecting the metal at the time.
Forex Markets
Currency markets can experience recurring influences associated with trade flows, corporate hedging, portfolio rebalancing, and scheduled economic activity.
However, currencies are relative prices. EUR/USD, for example, reflects developments affecting both the euro and the US dollar. A pattern that appears in one currency pair may not apply to another, and monetary-policy changes can alter historical relationships.
Forex seasonality should be tested using the specific pair, timeframe, and trading rules intended for use.
How to Evaluate a Seasonal Trading Strategy
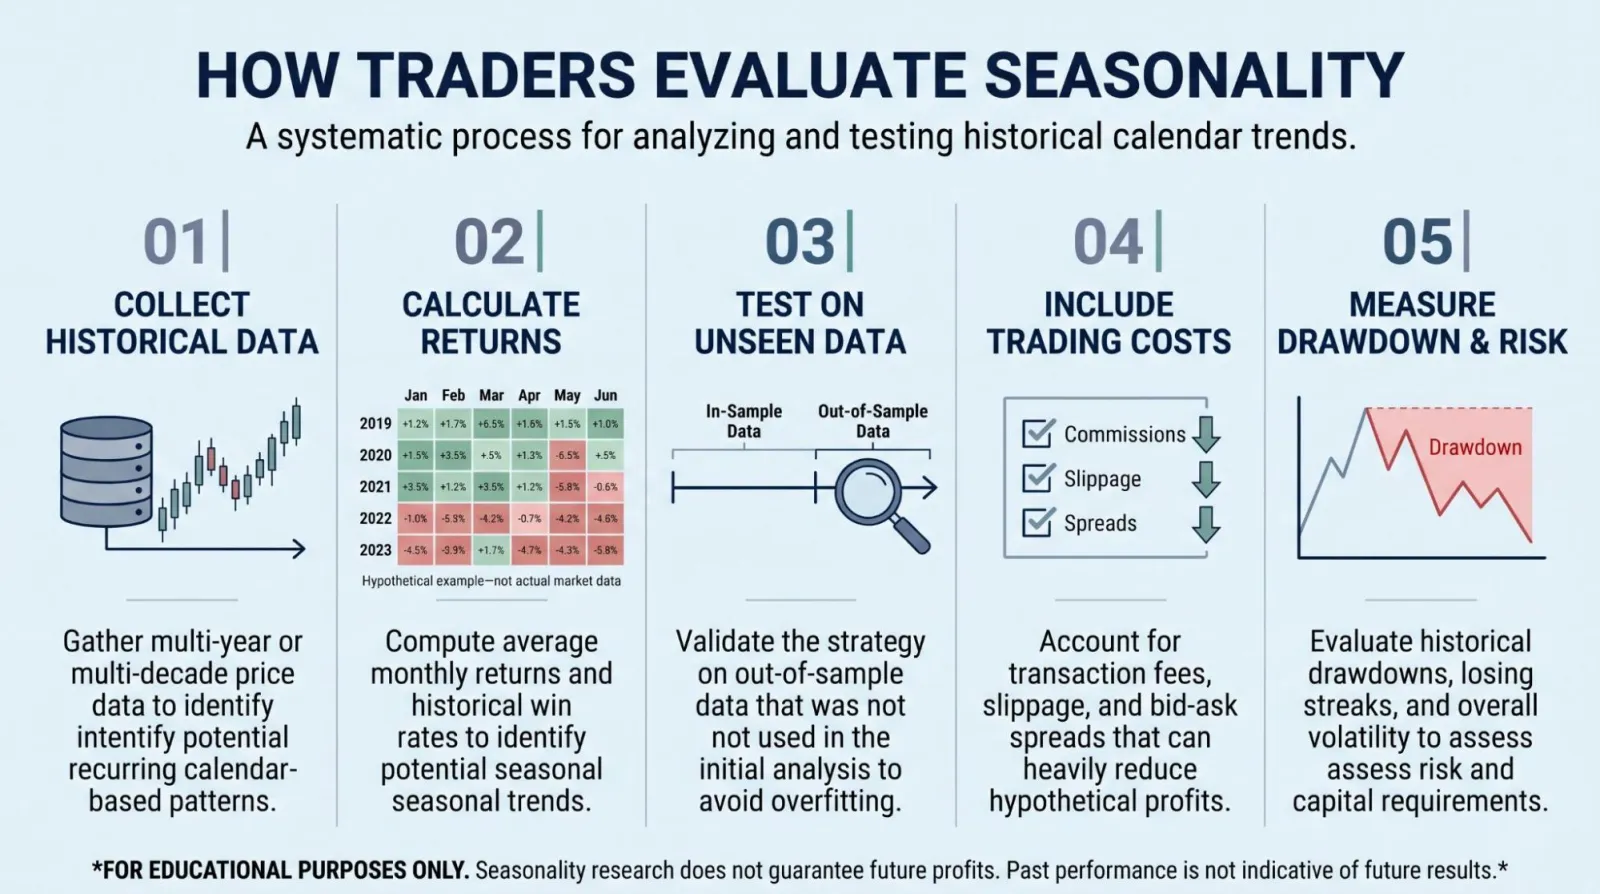
Before using a seasonal pattern, traders should ask whether the evidence is strong enough to justify further testing.
Use Enough Historical Data
A short sample may capture an unusual period rather than a recurring tendency. Where reliable data is available, examine multiple market environments, including periods of economic expansion, recession, high inflation, and changing interest rates.
More data is not automatically better if the market structure has changed significantly. Older observations may be less relevant under different trading conditions.
Separate Pattern Discovery From Testing
If a trader discovers a pattern and repeatedly adjusts the rules until the historical results look attractive, the strategy may simply be overfitted to past data.
One way to reduce this risk is to develop the idea using one portion of the historical data and then evaluate it on a separate period that was not used to create the rules.
The second test provides a more meaningful indication of whether the pattern may generalise beyond the original sample, although it still cannot guarantee future performance.
Include Realistic Trading Costs
A strategy that appears profitable before costs may be unprofitable after spreads, commissions, slippage, financing, and other expenses.
This is particularly important for short holding periods, where transaction costs can consume a significant share of the expected return.
Measure Risk as Well as Returns
A high average return does not tell the whole story. Traders should also evaluate drawdowns, volatility, losing streaks, exposure, and how the strategy behaves during unfavourable periods.
They should ask whether the strategy's losses are manageable and whether its performance depends on a small number of exceptional outcomes.
Avoid Treating a Seasonal Window as a Guarantee
Even a historically consistent pattern can fail. New economic conditions, policy changes, unusual weather, geopolitical events, and shifts in market structure can change the way an asset behaves.
A seasonal tendency should inform a trading hypothesis, not replace a risk-management plan.
Combining Seasonality With Other Forms of Analysis
Seasonal analysis is often more useful when combined with other research methods.
Fundamental analysis can help explain whether the economic conditions that may have contributed to a historical pattern are present today. In an agricultural market, for example, a seasonal tendency may be more meaningful when current crop conditions and inventory data support the same view.
Technical analysis can help traders assess current price structure. A seasonal bias may suggest an area of interest, while a trend, breakout, or support level can help determine whether the market is showing the expected behaviour.
Intermarket analysis can provide additional context. A gold seasonal pattern, for example, may be evaluated alongside real yields, the US dollar, and broader investor demand.
These methods do not necessarily need to agree at all times. Conflicting evidence can be a reason to reduce confidence in a trade idea, wait for more information, or avoid the trade altogether.
The goal is not to accumulate as many signals as possible. It is to understand what each piece of evidence contributes and whether the combined approach has been tested objectively.
Common Mistakes in Seasonal Trading
- Assuming historical tendencies will repeat: A recurring pattern can weaken or disappear when market conditions change.
- Choosing a pattern because it looks profitable in a chart: Visual observations can be misleading, especially when many possible dates and markets have been examined.
- Ignoring the reason behind the pattern: Understanding the economic or commercial mechanism can help traders assess whether the pattern remains relevant.
- Overlooking transaction costs: Small historical advantages may disappear after realistic execution costs are included.
- Using too many filters: Adding conditions until a strategy fits historical data can make it less reliable in new market conditions.
- Treating an expert's name as proof: A strategy attributed to Larry Williams—or any other trader—still needs clear rules, reliable evidence, and independent evaluation.
Conclusion: Use Seasonality as Evidence, Not a Prediction
Seasonality gives traders a way to investigate whether markets have displayed recurring behaviour at particular times of the year. Larry Williams' work is relevant to traders interested in historical patterns and systematic methods, but no seasonal approach should be accepted simply because it is associated with a well-known trader.
The useful question is not whether a market usually rises or falls during a particular period. It is whether a clearly defined pattern has shown a meaningful, repeatable tendency after accounting for risk, costs, and changing market conditions.
For traders, the strongest approach is to study reliable historical data, test the rules on unseen periods where possible, understand the potential reasons behind the pattern, and combine the results with other relevant analysis.
Seasonality can contribute to a trading process, but it should never be treated as a guarantee of future market behaviour.
Build a bot from your idea
Describe your trading idea and the AI writes MT4 or MT5 code for you to review and test, with a plain-English explanation and setup steps. Your first bot is free.