Blog / Code & convert EAs · Backtesting · Expert Advisors
Overfitting: How to Spot a Curve-Fitted EA
Learn how to identify curve-fitting in an MT5 Expert Advisor and test whether its strategy can perform beyond historical data.
· 5 min read
An Expert Advisor can produce an impressive backtest and still fail when you run it on a live account. One possible reason is overfitting.
Overfitting happens when an EA's parameters are adjusted so closely to historical market data that the strategy captures patterns specific to that period rather than a repeatable trading edge.
The result is an EA that looks excellent in the Strategy Tester but struggles when market conditions change.
An EA advertising extraordinary historical returns, an unusually smooth equity curve, and almost no drawdown may look attractive at first glance. However, these results deserve closer examination. They could reflect aggressive optimisation, curve-fitting, unrealistic testing assumptions, or other weaknesses that may not survive real market conditions.
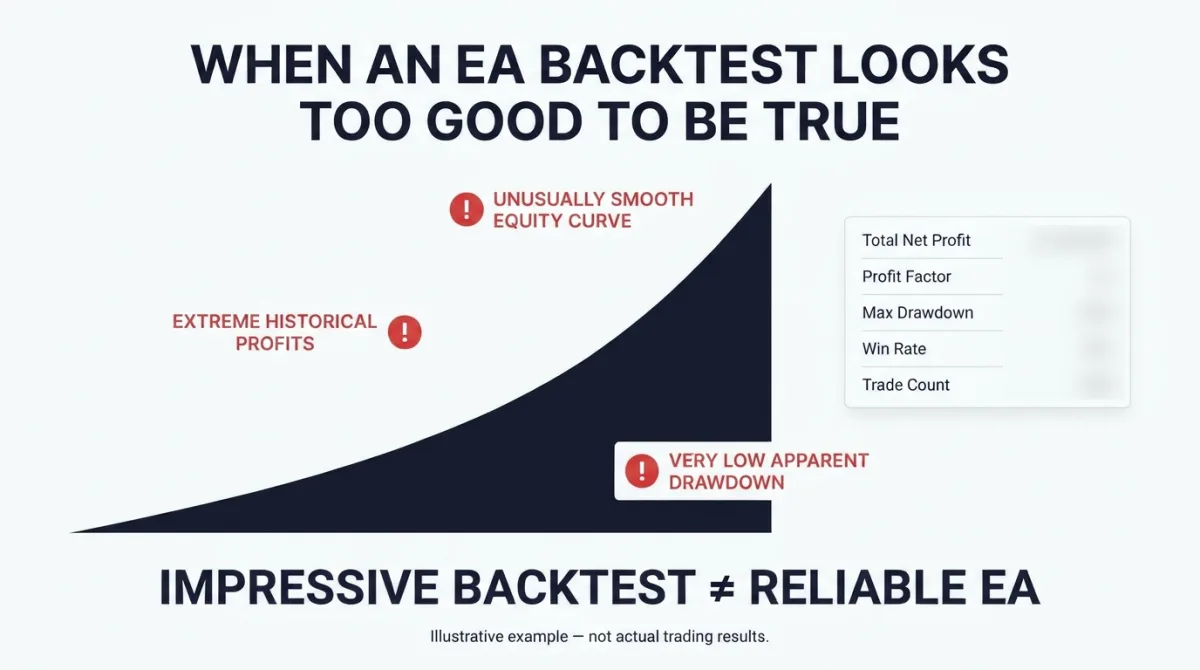
In this guide, we'll look at practical ways to identify curve-fitting in an MT5 Expert Advisor before trusting its backtest results.
1. Understand what curve-fitting looks like
Imagine testing an EA with different moving-average periods, stop-loss distances, take-profit targets, and indicator settings.
After hundreds of combinations, you find one configuration that produces exceptional historical returns.
The problem is that the settings may simply have been tailored to the historical price movements in the test period.
Common warning signs include:
- Extremely high historical profits with unusually small drawdowns.
- A large number of optimised parameters.
- Performance that collapses when one parameter changes slightly.
- Excellent results over one date range but poor results over another.
- A strategy that works on one symbol but fails on closely related instruments.
None of these signs proves overfitting on its own. However, several appearing together should make you cautious.
2. Look beyond the best optimisation result
MT5's Strategy Tester includes an optimisation feature that allows you to test multiple parameter combinations.
It is tempting to select the configuration with the highest profit and assume you've found the best version of the EA.
That approach can be misleading.
Instead, examine the surrounding results. If one particular combination produces exceptional returns while nearby settings perform badly, the strategy may be highly sensitive to its parameters.
For example, consider a hypothetical EA optimised using moving-average periods:
| Fast MA | Slow MA | Net profit |
|---|---|---|
| 8 | 30 | $1,250 |
| 9 | 30 | $1,310 |
| 10 | 30 | $1,280 |
| 11 | 30 | $1,190 |
| 12 | 30 | $1,160 |
| 13 | 30 | $420 |
| 14 | 30 | -$180 |
These are made-up figures to show the pattern, not results from a real EA.
The sudden deterioration between periods 12 and 14 deserves investigation.
A more convincing result is one where a reasonable range of nearby parameter combinations performs consistently, rather than one isolated setting producing nearly all the profit.
3. Separate development data from validation data
One of the most useful ways to detect overfitting is to avoid evaluating a strategy exclusively on the data used to develop it.
Divide your historical data into two sections:
- In-sample data: The period used to develop and optimise the EA.
- Out-of-sample data: A separate period reserved for evaluating the resulting strategy.
For example, you could use 2020–2023 for development and reserve 2024–2025 for validation, assuming the data is available and sufficiently representative.
Optimise the EA using the first period, select a reasonable configuration, and then test that configuration on the untouched second period. MT5 can do the split for you: Walk-Forward Testing in MT5 shows how.
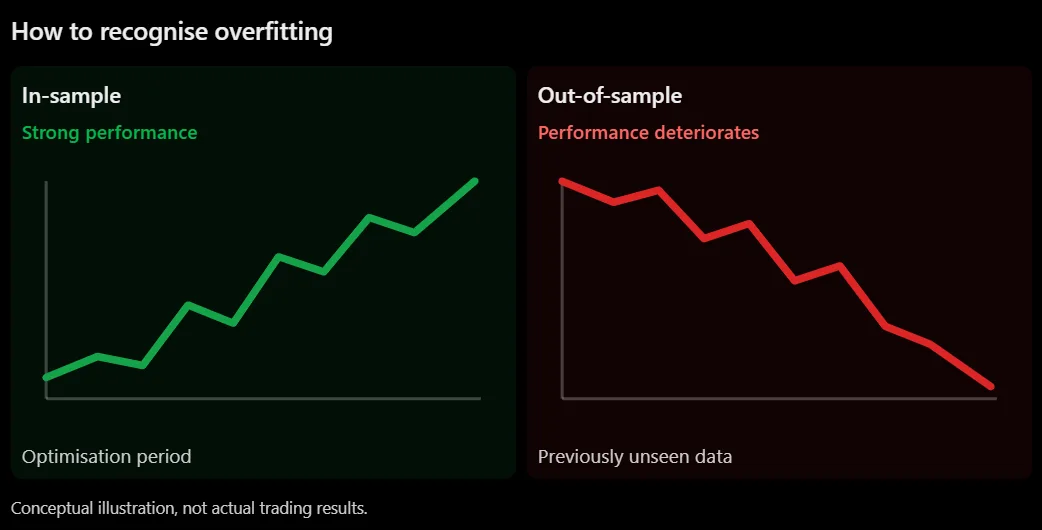
Do not keep adjusting the EA until it performs well on the validation data. Doing so gradually turns that supposedly independent period into another optimisation dataset.
If performance deteriorates out of sample, investigate why. The strategy may have been fitted to historical conditions that did not persist.
4. Check whether performance depends on a particular market condition
A strategy can appear to work because it was tested during a period that strongly favoured its trading logic.
For example, a trend-following EA might perform exceptionally well during a prolonged trending market but struggle during extended sideways conditions.
Review the EA across different market environments:
- Trending and ranging markets.
- High- and low-volatility periods.
- Different trading sessions.
- Different historical date ranges.
Also examine the number and distribution of trades. A strategy that earns most of its profit from a handful of unusually successful trades may be less reliable than one with more consistent results.
The objective is not to demand identical performance everywhere. It is to understand where the strategy works, where it struggles, and whether its results depend excessively on a narrow set of conditions.
5. Test parameter stability
A robust EA should not necessarily produce identical results with every parameter setting. However, small, reasonable adjustments should not normally destroy its entire performance.
Take the selected configuration and test nearby values for its important inputs.
For example, if the EA uses a stop-loss distance of 300 points, test nearby values such as 270, 285, 315, and 330 points, provided they remain sensible for the instrument and strategy.
Compare more than net profit:
- Maximum drawdown.
- Profit factor.
- Expected payoff.
- Total trades.
- Recovery factor.
- Equity curve consistency.
Look for a reasonably stable region rather than a single exceptional result.
Be careful not to interpret every parameter change in isolation. Some inputs interact, and changing several simultaneously can make it difficult to identify what caused a performance difference.
6. Don't confuse a good backtest with a reliable EA
Even a strategy that passes these checks can encounter problems in live trading.
Historical testing cannot perfectly reproduce future market conditions, execution delays, liquidity changes, or unexpected volatility. Why an EA works in the tester but fails live covers the most common differences.
Before relying on an EA, also account for realistic trading costs, including spread, commission, and slippage. An apparent edge can disappear when these costs are included; Spread, Commission and Slippage explains how to model them in MT5.
A useful evaluation process should therefore combine:
- Sensible strategy development.
- Separate in-sample and out-of-sample testing.
- Parameter sensitivity checks.
- Testing across different market conditions.
- Realistic execution-cost assumptions.
- Forward testing on a demo account where appropriate.
Conclusion
Curve-fitting is one of the easiest ways to mistake historical luck for a genuine trading edge.
An impressive MT5 backtest is not enough. Look at the surrounding optimisation results, test on unseen data, examine performance across different market conditions, and check whether small parameter changes cause disproportionate deterioration.
The goal is not to build an EA that perfectly explains the past. It is to develop one with a trading logic that has a reasonable chance of remaining useful beyond the data used to create it.
With PositionAlpha's Bot Builder, you describe your trading idea and the AI writes MT4 or MT5 code for you to review and test, with a plain-English explanation and setup steps. Run the checks above on it in the Strategy Tester, and test it on a demo account before you rely on it.
Build a bot from your idea
Describe your trading idea and the AI writes MT4 or MT5 code for you to review and test, with a plain-English explanation and setup steps. Your first bot is free.